i INP-WEALTHPK
Shams ul Nisa
GlaxoSmithKline Pakistan Limited recently announced its financial report for the first half (January-June) of the ongoing calendar year 2023, posting an increase in revenue, but a hefty decline in profitability because of the high inflationary pressures and increased cost of doing business. The pharmaceutical company posted a total revenue of Rs23.25 billion in 1HCY23 in contrast to Rs18.16 billion in 1HCY22, accounting for a total growth of 28%. This growth in revenue is attributed to the rise in the price of products compared to the previous year and efficient implementation of the policy decisions.
Despite the rise in revenue, the company’s gross profit fell by 59.03% to Rs1.59 billion in 1HCY23 from Rs3.89 billion in 1HCY22, reflecting the increase in cost of production. The cost of production rose because of significant currency devaluation, high inflation and increased fuel prices. GlaxoSmithKline Pakistan Limited’s major activities include manufacturing and marketing of research-based ethical specialities and pharmaceutical products.


Furthermore, administrative expenses of the company went up to Rs869.6 million in 1HCY23, constituting a rise of 22.54% from Rs709.6 million the previous year. Operating profit during the period fell sharply to Rs717.1 million from Rs2.56 billion in 1HCY22, registering a significant decline of 72.02%. This decrease indicated the core activities of the company were less profitable during this period. Additionally, the profit-before-tax also reduced by 84.07% to Rs350.9 million in 1HCY23 from Rs2.20 billion in the previous year.
Similarly, the net profit experienced a massive drop of 151% in 1HCY23 as the company sustained a staggering net loss of Rs321.83 million during the period under review in contrast to a net profit of Rs631.2 million over the same period last year. Likewise, the earnings per share of Rs1.98 in 1HCY22 turned into a loss per share of Rs1.01 in 1HCY23, reflecting the decreasing interest of investors in the stocks of the company.
Historical analysis (current ratio)
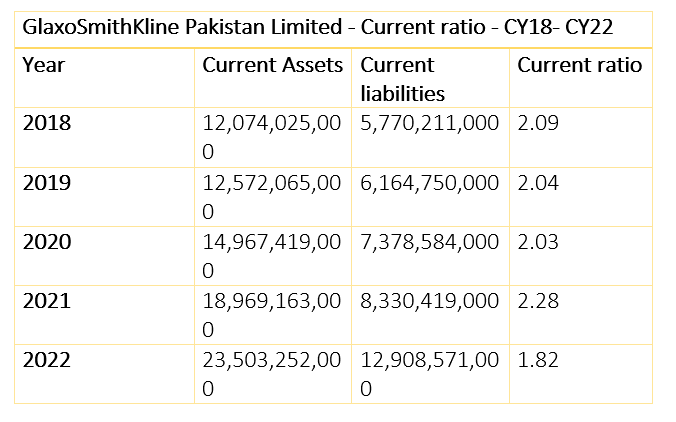
The current ratio measures the strength of the company to meet its current obligations using its current assets. The ratio below 1.2 reflects the company’s higher risk of meeting its short-term obligations, while the ratio ranging from 1.2 to 2 and above is usually safe.

The historical analysis of current ratio reflects a healthy trend over the years from 2018 to 2022, reflecting a stable liquidity position of the company. The ratio slightly decreased from 2.09 in 2018 to 2.04 in 2019 and 2.03 in 2020. This decline can be attributed to the decrease in the liquidity position of the company that is the current assets. The current ratio rose to 2.28 in 2021 but fell to 1.82 in 2022. This decline in current ratio reflects the increase in current liabilities during the period.

Gross profit ratio
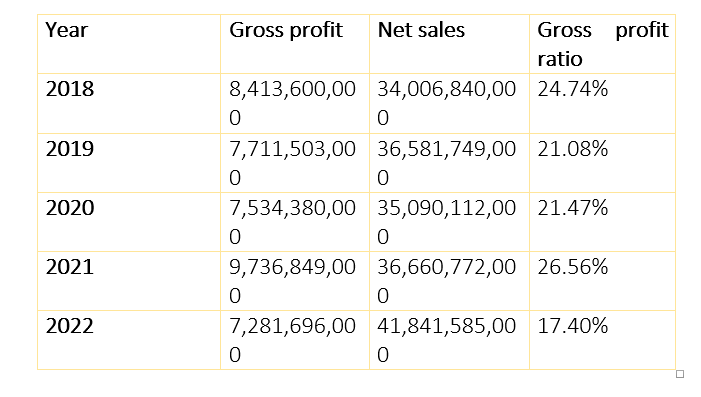
The gross profit ratio remained relatively stable over the time. It stood at 24.74% in 2018, but declined to 21.08% in 2019, and slightly moved up to 21.47% in 2020. This indicates that the profit generated from sales declined marginally over the time, without any change in the cost of production of the goods sold by the company. In 2021, the company experienced the highest gross profit ratio of 26.56%, which fell to 17.40% in 2022.
![]()

Net profit ratio
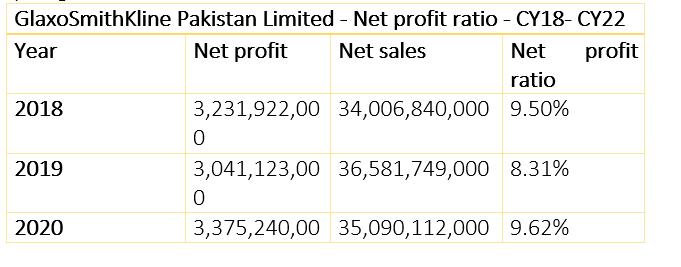
Net profit ratio of the pharmaceutical company exhibited a fluctuating trend over the period. The company registered a net profit ratio of 9.50% in 2018, but fell to 8.3% in 2019. The net profit ratio regained its momentum and rose to 9.62% in 2020 and 14.61% in 2021. In 2022, the company’s net profit ratio plunged to 5.89%.


Operating profit ratio
The GlaxoSmithKline Pakistan Limited’s operating profit ratio varied over time. The highest operating profit of 20.70% was observed in 2021 because of a rise in net sales. The lowest operating profit ratio was recorded at 13.37% in 2019, due to the impact of Covid-19 pandemic.

Credit: INP-WealthPk


